About three weeks ago, in Post #1235, I showed you where you could look up the reported COVID-19 cases at any Fairfax County public school. This includes City of Fairfax, but not City of Falls Church.
In that prior post, I showed that it appears that the FCPS data capture about 60% of all COVID-19 cases in the Fairfax County school aged population. That’s by comparison to Virginia Department of Health counts of new cases within that age group.
In September, so far, there have been 522 known student infections in Fairfax County Public Schools (FCPS). That’s according to rhe FCPS COVID-19 case dashboard” at this link. That’s a rate of about 12 new cases / 100K pupils / day, based on a student enrollment of 188,000 (reference). This seems in-line with the rate for the Virginia population in general.
I find that FCPS dashboard site remarkably hard to use, other than as eye candy. And, at this point, they seem to have fixed is so that you can look at whatever graphs FCPS allows you to look at, but nothing else.
You can look up data for individual schools. I think that’s new since the last time I looked at that site, but I’m not sure. It’s also possible that I just didn’t notice that you had to scroll right to find a drop-down menu.
It’s not obvious how to do that. I’m doing this on a laptop computer. No idea how this looks on a phone.
On a computer, if you go to the FCPS dashboard, click the third tab above the graph “Reported cases by …”, scroll right to find the drop-down menu at the far right, and click on the school of interest.
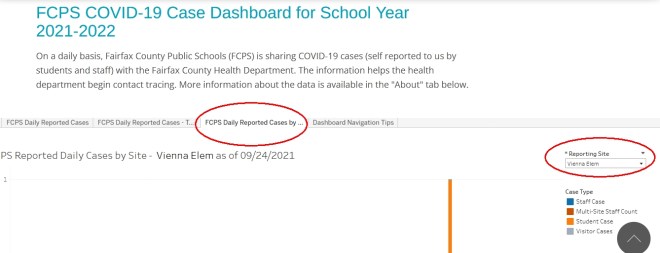
Work through all that, and you can see a graph showing spikes on days that cases were reported. FCPS shows you the data in reverse chronological order, with most recent cases on the left edge of the graph.
Want to know total cases to date? Add them up by hand, after looking at that graph. Want to know the time trend? Eyeball the graph, factoring in all the days when no case was reported.
This highlights the second change, in that FCPS no longer allows users to download the underlying data. FCPS uses the Tableau system for posting these (“Motto: Where data goes to die”). As is often the case with Tableau, they’ve set that system to block access to the actual underlying numbers. The file I downloaded three weeks ago is no longer available to the public. (Or, if it is, they’ve so successfully hidden it that I can no longer find it.)
This means that the only listing by school is what you can generate, one school at a time, in the fashion that FCPS allows you, using Tableau, above. And the only information you can get about the change in cases over time is what FCPS allows you to know, via what they have tabulated.
This also means I no longer have any value to add to this process. Which is why this is my final update.
I might revisit this if we get a severe winter wave of COVID-19 in Virginia. Otherwise, for now, all you’re allowed to know is that there’s a stream of reported COVID-19 cases in FCPS K-12 schools. Look up your school if you care to, and can find the right tab and the off-screen drop-down menu to the right.
If you want to guess whether that new case rate is rising or falling in FCPS, you have to guess that from the graph that FCPS generates. If you want to know that, click the first tab on the dashboard graph, look at the daily spikes on the graph, and by eye, try to integrate the area under curve that is implied by the tops of those spikes.
 You have to do it that way because, as near as I can tell, FCPS no longer releases any underlying data on case counts. You are only allowed to see what FCPS itself graphs out for you. You are only allowed to see what FCPS wants you to see.


