
Source: Amazon.com
As our Federal government stumbles toward a public mask policy at a glacial pace and with off-the-cuff advice, let’s see if we, the people, can get ahead of the game on this one.
The just-prior post already established that a reasonable home-made mask will do just fine for protecting others. This next series of posts is about protecting yourself.
And this post is about what you can buy, right now. Its about expedient masks, meaning anything you can buy or make to serve as a face mask, that would (we hope) never be used by health care workers. Anything other than real medical masks — either N95 (or equivalent hardware-store P95) or proper, certified surgical masks — such as might be used in a hospital.
Upshot:
If you want to buy a plausibly-effective sanitary mask, right now, for wearing in public, it looks like your sole option is disposable “surgical” masks bought through Ebay. As discussed below, these are not actually proper certified surgical masks, and some of them are in fact simple “single-use” masks, as described in my just-prior post. You can order the same thing through Amazon, but typical wait times are about a month. I list out the features you want to see in those masks, if you buy them, below.
Caveat emptor: I just looked at Ebay, and there are clearly a lot of unscrupulous sellers, and a general air of on-line panic shopping. If you absolutely have a need for these, consider it. But be aware that you may well be wasting your money.
In addition, anybody who is in the business of throwing away N95 or P95 masks (respirators) should read this analysis of how long an N95 may be re-used. The answer is, putting aside the issue of sterilization, a long, long time. Which is good, because (e.g.) the screeners at Dulles Airport have been asked to re-use their masks on a permanent basis. So, even if you don’t re-use them now, it’s probably time to start separating them from the rest of the waste stream and retaining them.
What’s off-limits, what’s available on Amazon
This post is about masks that you can buy, right now. And, separately, how you might modify them to improve their filtration capabilities. I’m not going to spend a lot of time on this, because I suspect that when CDC issues guidance that Americans should wear masks when in public, anything for sale will disappear from the shelves.
I am sticking with Amazon, for the time being, because they appear to be doing things responsibly, as discussed below. As I read it, right now, if you see it for sale to the general public on Amazon, that’s because it’s not needed by the US health care system. That is not uniformly true of places like Ebay. So I’m only going to look at items that are for sale on Amazon. I may check availability of those same items on Ebay. Clear enough?
I spent some time explaining the technical jargon in the last post, so I am going to feel free to use those terms around here without explanation. Just refer the last post.
But this is not about protecting yourself, at the expense of the health-care workers. In my last post, I explained why hospital workers need N95 masks and you don’t, under the section on aerosol transmission of disease. So let me list not just the things you can buy, but the things you shouldn’t buy.
N95, P95, P99, P100: NO.

Source: Wikipedia
If you stumble across anything rated N95 or P95 or better, just leave it alone, unless you plan to purchase it for donation to your local hospital or fire and rescue unit. You should not be able to find these for sale now, but that’s only because responsible companies have withdrawn them. (See Home Depot in just-prior post. I don’t think the Federal government has taken any action to make the sale of these (to other than medical/fire/rescue providers) illegal. This class includes not only classic N95 “masks” as above, but (e.g.) anything like the P100 paint respirator pictured at the very top of this posting.
Again, you don’t need it. Health care workers and fire and rescue units are going to need them. See my prior post on why health care workers need them, and you don’t.
Surgical masks certified for medical use: NO.
Source: Wikipedia.
I’m not sure if you can find proper certified surgical masks for sale or not, but ditto the remarks above on N95s. Leave them for health care workers. Please see the prior post for a discussion of the difference between single-use masks and surgical masks, and the filtration standards.
Note that several large-scale controlled clinical trials show that surgical masks are just as good as N95 respirators at preventing flu infection among hospital workers. An excellent summary is here, at Smart Air. So, in a pinch, you bet hospital workers would use those if N95 respirators are not available.
Read my just-prior post for the difference between certified surgical masks, and “single-use” masks, which you can buy, and which are not critical to the US health care system right now.
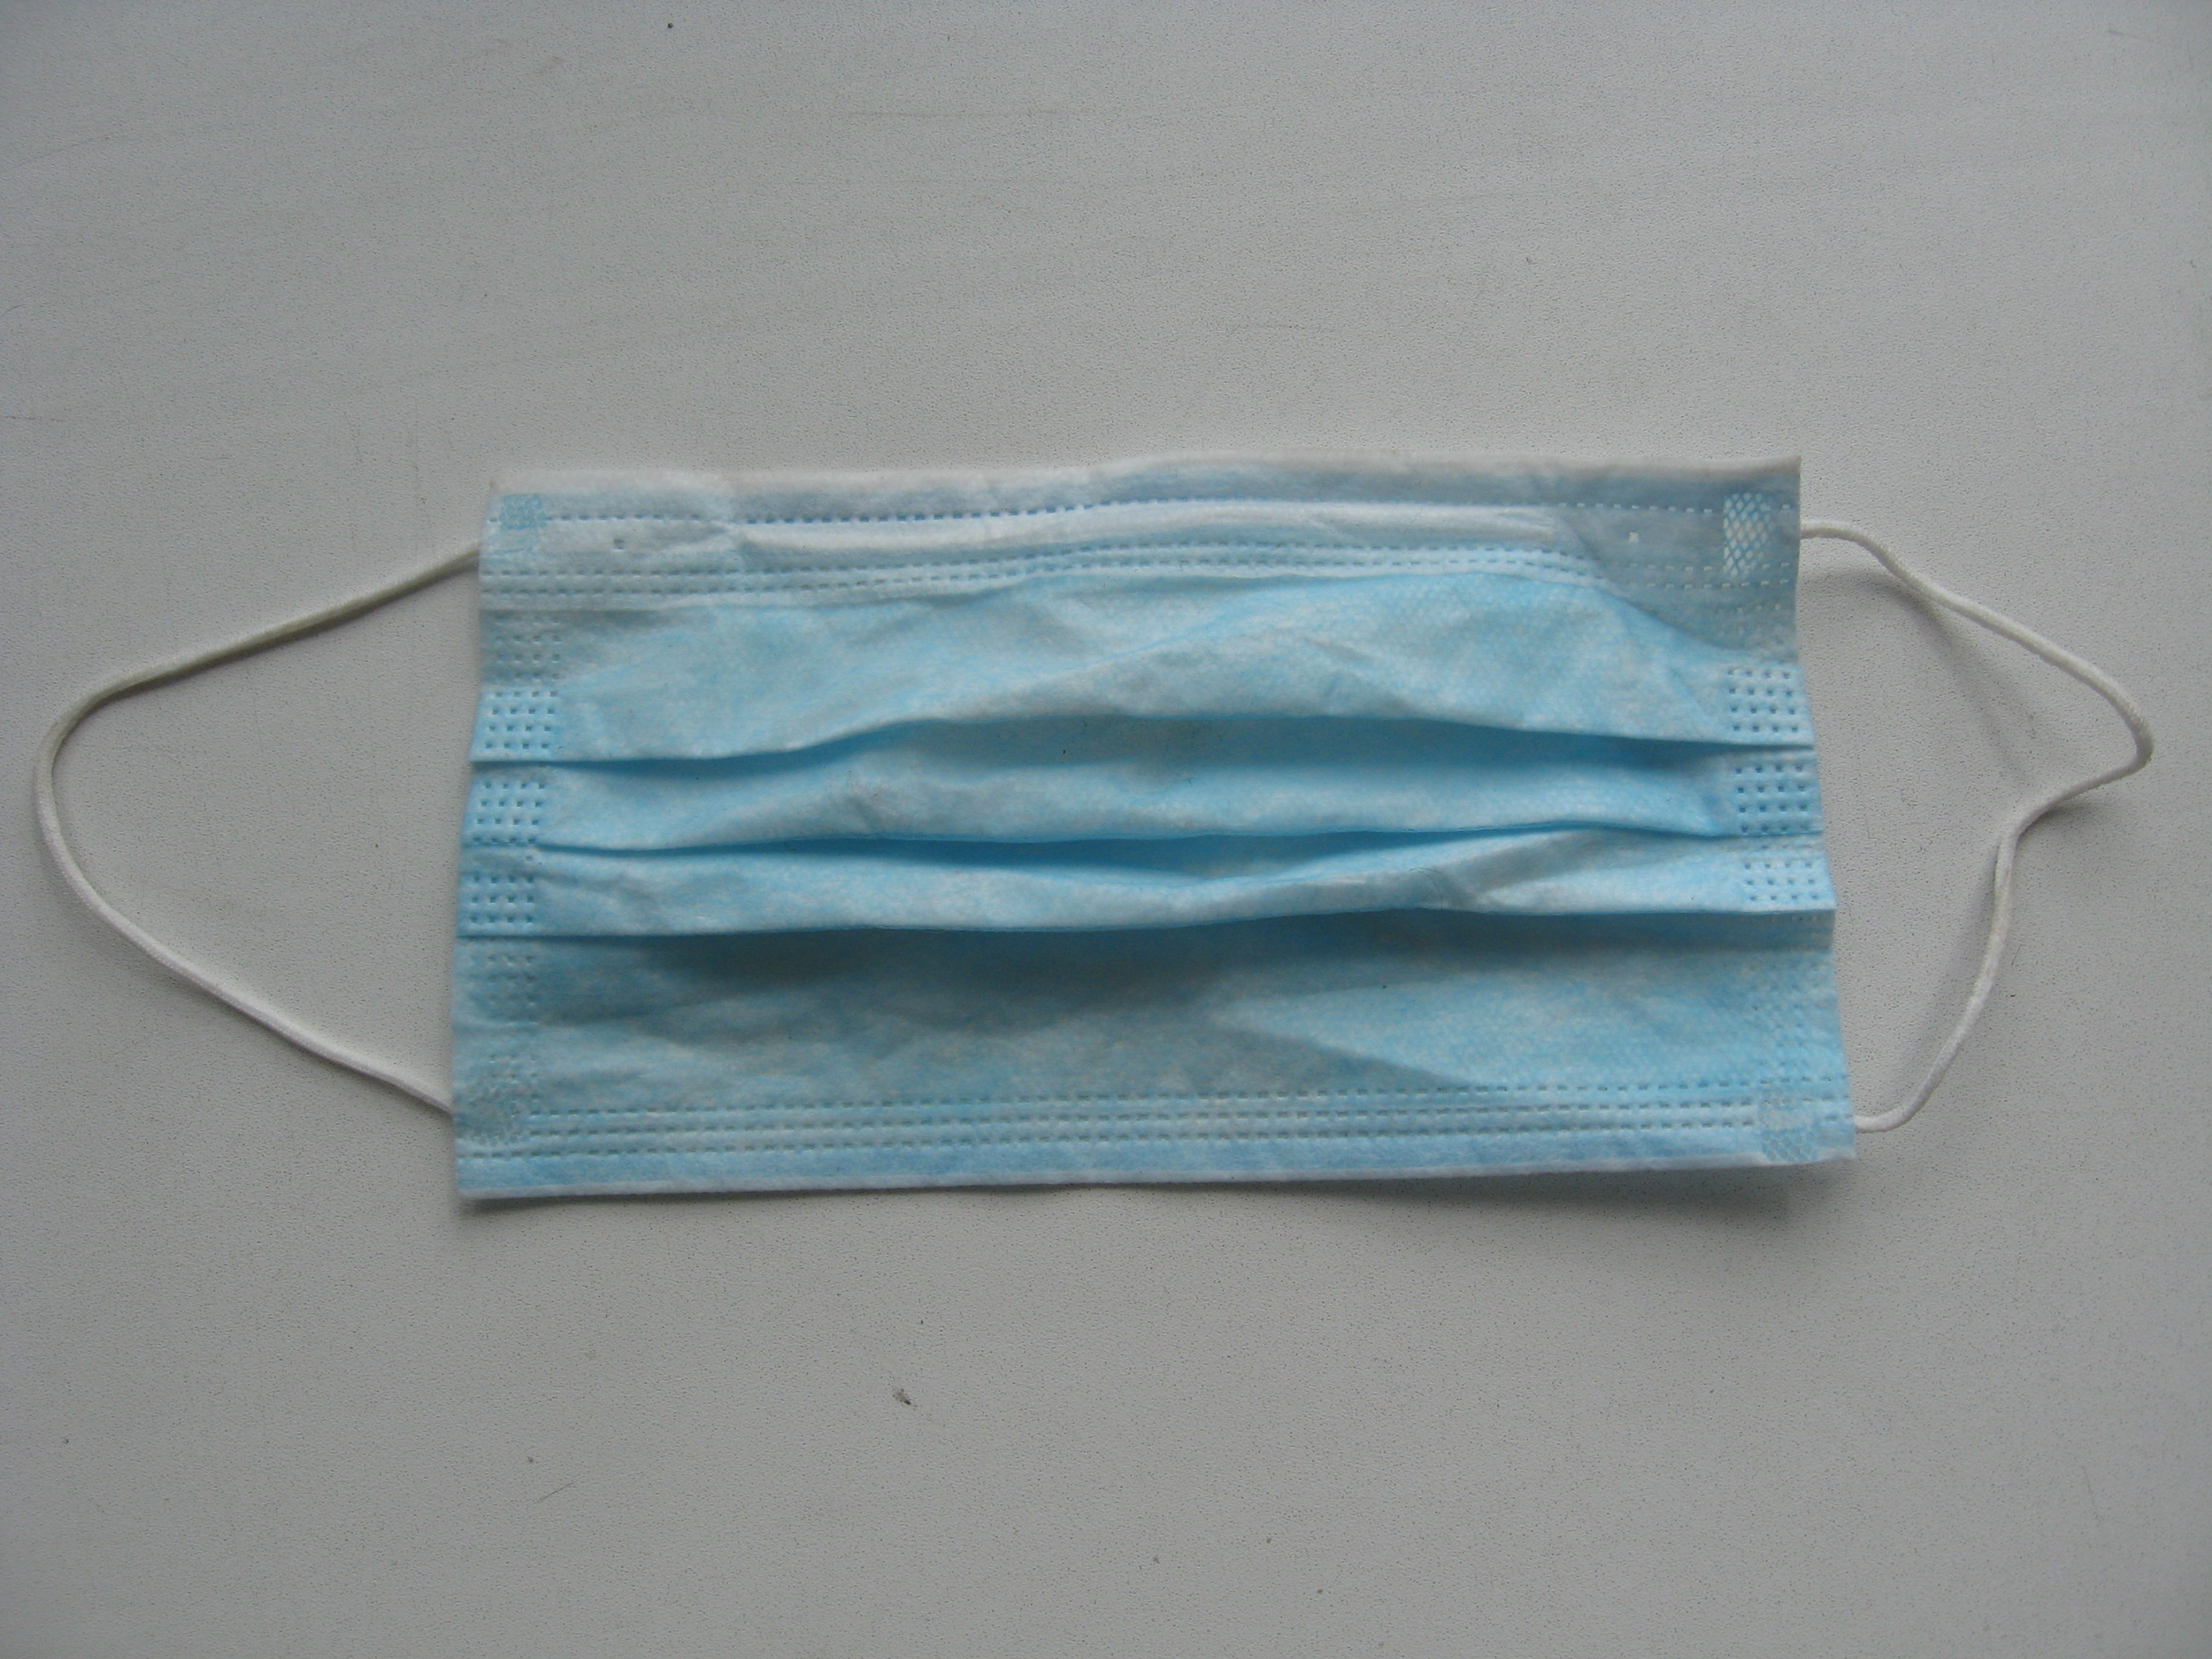
Things that look like surgical masks but are not certified for medical use, available on Amazon, and are probably “single-use masks”, not surgical masks (defined below): I would say, yeah, for now, probably YES.
Wait times are long (typically one month) on Amazon, but this same sort of produce appears widely available (for now) on Ebay with short delivery times promised.


Source: Amazon
What makes me say that? Amazon is one of the responsible vendors who have pulled all masks that can be used by medical personnel and first responders. Anything like that, their pages now have this wording:
Available only for hospitals and government agencies directly responding to COVID-19
For example, Amazon has withdrawn not only N95 respirators, but high-quality nuisance dust masks as well. They have withdrawn surgical masks that appear to be certified for medical use. (Note that those masks list their actual filtration rates, whereas the ones that remain for sale do not.) To me, that suggests that they really have gone through their inventory and pulled out anything that would be useful to medical providers or first responders.
I have to infer, then, that if Amazon doesn’t say that, then there has been some professional judgment that the item in question is not needed by health care workers. I am not 100% sure about that, but at some point, I have to believe that Amazon knows its business, and has done the right thing, and has stopped sale of all items that would be useful to health care workers (as Home Depot has done.)
An incredibly helpful and succinct discussion of single-use masks, surgical masks, and N95 respirators, along with considerable other helpful information (e.g., can you wash disposable masks) can be found at Smart Air. If you want to get up to speed on what’s what, for actual medical supplies, that’s the place to start.
So, provisionally, I’m going to say, despite some misgivings, these are probably OK to buy. I’m guessing that most of them are, in fact, “single-use masks” and not surgical masks. If (note, if) those were manufactured to any standard, it would be a Chinese standard, and they would be able to filter out 95% of large aerosol droplets (3 microns), but would not filter something the size of a virus. Proper surgical masks, by contrast, will filter out virus-sized particles. Again, see Smart Air for a discussion of mask standards.
Even though these are not certified, and some appear to be poorly made, many of them do appear to have the right construction:
- Three-ply construction, with
- A layer of melt-blown fabric, and
- A metal strip at the bridge of the nose.
To the extent that these are fairly good at filtering the air, that’s due to the melt-blown fabric and the nose piece. See prior post for “melt-blown fabric”. (You don’t know the quality/specs on the melt-blown fabric, but at least it has some, suggesting that it has filtering ability above-and-beyond what you’d get from just paper.) The nose piece is required to seal up what would otherwise be the largest air leak for the mask, right at the bridge of the nose.
Finally, multiple large-scale controlled clinical trials have shown that proper, certified surgical masks (not single-use masks) work just as well as N95 respirators at keeping hospital workers from catching the flu. (Cite Smart Air). Whether or not whatever-these-are on Amazon — single-use masks or possibly uncertified surgical masks — would work as well as certified surgical masks is a complete unknown. For sure, single-layer single-use masks, even if they were built to the Chinese standard, have no ability to filter virus-sized particles. They would not have the filtration capacity of a certified surgical mask.
Check the delivery time before you buy. The main catch here is delivery time. That nice-looking white mask above? I searched “face mask”, sorted by descending customer rating, and checked the earliest promised delivery time for the first 20 entries. Median earliest promised delivery date was 26 days. Three entries promised delivery within six days. Two of those were of such low quality (by description and customer comments) that I doubt they would work. The third was priced at about three times the going rate for masks.
The upshot on delivery is that a) for the typical product, it’s going to take a month, and b) anything promised for near-term delivery is either too poor to be useful, or (in one case) priced at several multiples of the going rate.
I re-sorted by descending price, and spot checked. Even for very large orders (e.g., 1000 masks) first promised delivery dates were about a month away.
To summarize: It appears that Amazon has stopped selling anything that has been judged useful to the medical or first-response sectors. The only safe thing is to assume that whatever you are seeing on Amazon, at best, meets the Chinese standard for filtration for single-use masks. If so, those would provide significant filtration against droplets, but limited filtration against aerosols and virus particles. (I.e., they aren’t as good as real surgical masks). Some of the disposable masks appear to have proper construction, per bullet points above. If so, you could reasonably assume that wearing them would offer you some protection, but that is just an assumption. The best of these have melt-blown fabric (the “filter” portion of a certified surgical mask), but you have no way of knowing what type of melt-blown fabric it is (i.e., how well it would filter air). Even with that, you should expect about a one-month wait time for anything that looks worth buying, or feed the occasional price gouger who is promising an earlier delivery time.
Can you get them now, on Ebay? Yes, that appears to be true. If you go that route, look for three-ply construction, metal nosepiece, melt-blown fabric, and some claim as to bacterial filtration. You have no idea whether the claim is right or not, but so be it. A fair price appears to be in the range of $0.70/mask or so, in large lots.
Fabric sports masks: YES, if you are wiling to modify it. What you can routinely get does not appear very effective as a protective mask, because these are designed to “breathe”. If you can sew, you can add a lining. If not, you can try to add a paper lining. You will definitely want to add a wire nosepiece to provide a tight fit across the bridge of the nose.

Source: Amazon
At present, everybody says that any type of fabric mask is OK. Masks like that are frequently sold as pollen/pollution masks for outdoor exercise. Amazon has a wide range of them. Most (perhaps all) are really not adequate for this task, consisting of a single layer of cloth. Because these are exercise masks, they are made to “breathe”, which is what you don’t want, right now.
At the minimum, you’d have to line these with something. Practically speaking, I think you’d have to resort to lining these with paper towels. That provides some protection, but not much (see prior post, last section). You would also want to take a bit of wire and either duct-tape it to the mask, or thread it through the mask, to provide a metal nosepiece for sealing the mask to your face at the bridge of your nose.
And, as with the disposable masks above, most have one-to-two-month shipping times. I saw a handful with promised delivery times of a couple of weeks. Weirdly, I did not find these on Ebay. Maybe I just didn’t have the right search terms.
I’m not going to pursue these any further.
“PM2.5 masks”: Eh, I’m not even sure what this means.

Source: Amazon
There is a huge range of masks — some hard-surfaced, as the one above, some fabric, some hybrid — that are sold as anti-air-pollution masks. That is, they claim to filter out particulate matter of 2.5 microns in size (PM 2.5).
Near as I can tell, as discussed in my prior post, there are no standards and there is no testing of these masks. Some probably work. Some probably don’t. I have no way to tell. I’m not going to discuss these further. The few that I checked appeared to have delivery days 6 weeks away or so.
Caveat emptor.
Various loose-fitting masks and bandanas. These protect others, a bit, but the lack of any seal means they provide very limited protection to you.

Source: Amazon
And, of course, even these have promised delivery dates 6 weeks out. These are single-layer loose-fitting cloth mouth coverings. Better than nothing, but probably not as good as just pulling your t-shirt up so it covers you nose and mouth. I don’t see value here.
Etsy hand-sewn cloth masks.
I did not pursue this option, but I would assume that some are available.
My next posts will discuss making masks.


